Charging Session Reports: A Vital Tool for EV Management
Charging session reports are an indispensable tool in the burgeoning world of electric vehicles (EVs). They provide a comprehensive record of each charging event, offering valuable insights for both individual EV owners and the broader EV infrastructure.
Understanding Charging Session Reports
In the rapidly evolving landscape of electric vehicles (EVs) and charging infrastructure, the effective monitoring and analysis of charging activities play a pivotal role in optimizing operations, enhancing user experience, and facilitating the transition to sustainable transportation. Central to this endeavor are charging session reports, which serve as comprehensive records documenting various aspects of EV charging transactions.
Definition of Charging Session Reports
Charging session reports are detailed summaries of EV charging transactions, capturing essential data points such as the start and end times of charging sessions, energy consumed, charging duration, charging station identifiers, and user-specific information. These reports provide a holistic view of charging activities, offering valuable insights into usage patterns, charging trends, and infrastructure performance.
Importance of Charging Session Reports in Monitoring and Analyzing Charging Activities
- Usage Tracking and Billing: Charging session reports serve as essential tools for tracking EV usage and facilitating accurate billing processes. By documenting the duration and energy consumed during each charging session, these reports enable operators to generate invoices and ensure fair pricing for charging services.
- Performance Monitoring: Charging session reports allow operators to monitor the performance of charging infrastructure, identifying issues such as downtime, equipment malfunctions, or inefficient charging stations. By analyzing charging session data, operators can optimize maintenance schedules, improve reliability, and enhance the overall user experience.
- User Behavior Analysis: Charging session reports provide valuable insights into user behavior and preferences, enabling operators to identify peak usage times, popular charging locations, and recurring patterns. This information can inform strategic decisions regarding infrastructure deployment, pricing strategies, and customer engagement initiatives.
- Grid Integration and Demand Management: By analyzing charging session data in aggregate, operators can gain a deeper understanding of EV charging demand and its impact on the electrical grid. This insight enables proactive grid management strategies, such as load balancing, demand response, and the integration of renewable energy sources, to ensure grid stability and maximize efficiency.
- Regulatory Compliance and Reporting: Charging session reports play a crucial role in regulatory compliance, providing documentation of charging activities for audit purposes. Operators must adhere to regulatory requirements regarding data privacy, transaction transparency, and environmental reporting, and charging session reports serve as a comprehensive record of compliance efforts.
Frame definition in charging session report context
The concept of “frame” in the context of charging session reports likely doesn’t refer to a physical frame or visual layout. Here’s a more relevant interpretation:
Frame in Charging Session Reports:
In the realm of Natural Language Processing (NLP), a “frame” represents a stereotypical situation with specific elements and their roles. In charging session reports, a frame could represent the concept of a “charging event.”
Frame Elements Identification:
The core components you identified earlier (date/time, duration, energy consumed, location, cost) would be considered the frame elements. These elements define the essential aspects of a charging event.
Frame Semantic Role Labeling:
Each element plays a specific role within the frame. Here’s an example of semantic role labeling for a charging event frame:
- Target: The EV being charged (implicit in the report)
- Time: Date and time of the charging session
- Duration: Length of time spent charging
- Quantity: Amount of energy consumed (kWh)
- Location: Where the charging occurred
- Cost: Price associated with the charging session (if applicable)
Frame Structure Analysis:
By analyzing the frame structure, we can understand the relationships between the elements. For example, the “time” element defines when the “charging event” occurred. Similarly, the “location” element specifies where the “charging event” took place.
Benefits of Frame Analysis
Frame analysis provides a structured way to understand the meaning of charging session reports. It allows for:
- Automated Processing: NLP systems can leverage frames to extract information from reports more efficiently.
- Standardization: Defining a common frame for charging events facilitates data exchange and analysis across different platforms.
- Improved Search: Frame-based search can help users find specific information within reports, like all charging events above a certain cost threshold.
Components of Charging Session Reports
Charging session reports consist of several key components, including the date and time of the session, duration of charging, amount of energy consumed, charging station location, and cost of the session. These components provide a comprehensive overview of charging activities, facilitating usage tracking, performance monitoring, and financial analysis for operators of electric vehicle charging infrastructure.
Date and Time of Charging Session: The exact date and time when the charging session began and ended are crucial components of charging session reports. This information provides a timestamp for each charging transaction, enabling operators to track usage patterns and analyze charging activity over time.
Duration of Charging Session: The duration of the charging session, measured in hours and minutes, indicates how long the vehicle was connected to the charging station. This metric helps operators understand charging behavior, identify outliers, and assess the efficiency of charging infrastructure.
Amount of Energy Consumed: The total amount of energy consumed during the charging session, typically measured in kilowatt-hours (kWh), quantifies the energy transferred from the charging station to the vehicle’s battery. This data point is essential for billing purposes, performance analysis, and environmental reporting.
Charging Station Location: The location of the charging station, including geographic coordinates or an address, provides context for each charging session. This information allows operators to track charging activity across different locations, identify high-demand areas, and optimize infrastructure deployment strategies.
Cost of Charging Session: The cost of the charging session, expressed in the local currency, represents the amount charged to the user for the energy consumed during the session. This metric is vital for billing and revenue tracking purposes, ensuring accurate invoicing and financial transparency.
Establishing Topical Authority in Charging Session Reports
Building trust and demonstrating expertise in your charging session reports is crucial. Here’s how to achieve topical authority:
Identifying Authoritative Sources:
- Government Agencies: The US Department of Energy (DoE) and the Environmental Protection Agency (EPA) offer resources on EV charging infrastructure and best practices.
- National Laboratories: Research institutions like the Argonne National Lab and the National Renewable Energy Lab (NREL) conduct research on battery technology and charging strategies.
- Industry Associations: Organizations like the Electric Drive Transportation Association (EDTA) and Charging Point Operator (CPO) Association represent stakeholders in the EV charging industry and provide valuable insights.
- EV Manufacturer Websites: Access user manuals and guides for specific EV models that contain information on charging procedures and data interpretation.
Establishing Credibility in Reports:
- Cite your sources: Provide clear references to the authoritative sources you used to support your claims.
- Data visualization best practices: Use clear and accurate data visualizations with proper labeling and explanation.
- Transparency in methodology: Explain how you collected and analyzed the data in your report.
- Target your audience: Tailor the report’s language and technical depth to the intended audience’s level of understanding.
Building Expertise in the Charging Sessions Domain:
- Stay updated: Keep up with the latest advancements in EV technology, charging infrastructure, and industry trends.
- Participate in industry events and discussions: Engage with EV enthusiasts, researchers, and industry professionals to broaden your knowledge base.
- Consider professional certifications: Programs like the Certified Electric Vehicle Infrastructure Technician (CEVIT) can enhance your expertise.
Expert Opinion Integration in Reports:
- Quote relevant experts: Include quotes or insights from recognized authorities in the EV charging domain to strengthen your report’s validity.
- Conduct interviews: If possible, interview experts on specific topics that might be relevant to your report.
By following these steps, you can establish yourself as a credible source of information in the area of charging session reports. This will add value to your reports and give stakeholders confidence in the insights you provide.
Charging Session Reports: Data Analysis
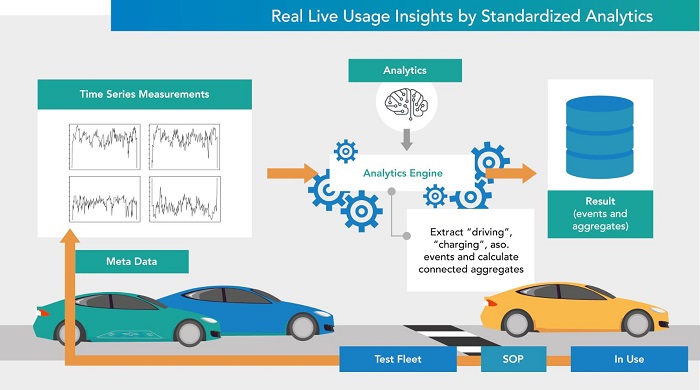
Data analysis plays a crucial role in extracting valuable insights from charging session reports. Here’s a breakdown of the key steps involved:
1. Data Collection Methods:
- EV Onboard Diagnostics (OBD): Modern EVs collect charging session data internally. This data can be accessed through the car’s display or mobile app.
- Charging Station Network Providers: Public charging networks collect data on usage at their stations. Users may access their personal charging history through the provider’s app or website.
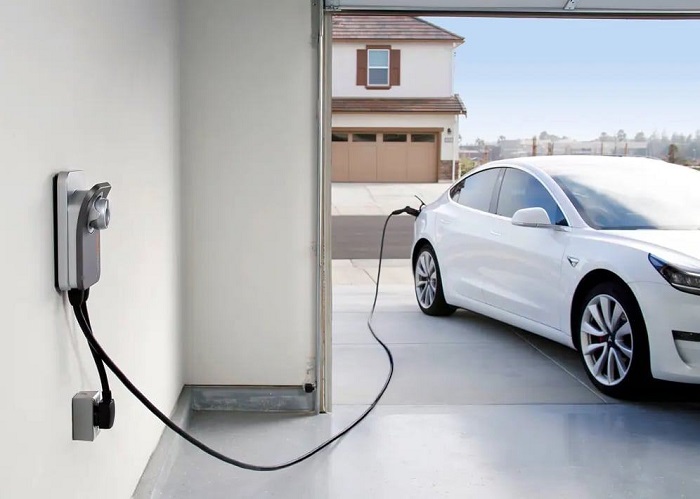
- Smart Meters: For home charging, smart meters can track energy consumption during a charging session. Data may be available through the utility company or a dedicated home energy management system.
2. Data Preprocessing for Reports:
- Data Cleaning: Ensure data accuracy by identifying and correcting any errors or missing values.
- Data Formatting: Standardize data formats (e.g., date/time) for efficient analysis.
- Data Aggregation: Combine data points from different sources or sessions for broader insights.
3. Data Visualization Techniques:
- Time Series Charts: Track trends in energy consumption or charging duration over time.
- Pie Charts & Bar Charts: Visualize the distribution of charging locations, charging speeds, or costs.
- Heatmaps: Identify peak charging times and locations for specific regions.
- Scatter Plots: Explore relationships between variables, like charging duration vs. energy consumed.
4. Data Interpretation in Charging Session Context:
- Charging Habits: Identify patterns in charging frequency, location preferences, and typical energy consumption.
- Charging Efficiency: Analyze variations in charging efficiency based on factors like temperature or charging rate.
- Cost Analysis: Evaluate the cost-effectiveness of charging at different locations or times.
- Battery Health: Monitor long-term trends in energy consumption, which might indicate potential battery degradation.
By using these data analysis techniques, stakeholders can gain valuable insights from charging session reports. This information can be used to:
- Optimize Charging Behavior: EV owners can identify the most efficient and cost-effective charging strategies.
- Improve Charging Infrastructure: Network providers can optimize station placement and capacity based on usage patterns.
- Develop Targeted Services: Utilities can offer dynamic pricing plans or incentives for off-peak charging.
Charging Session Reports: Formatting for Clarity and Impact
The format of your charging session reports significantly impacts how effectively they communicate information. Here are key considerations for crafting clear and impactful reports:
1. Standard Report Templates:
Pre-designed templates can be a good starting point, especially for basic reports. These are often available from EV manufacturers, charging network providers, or data analysis software. Templates should be customizable to include specific data points or visualizations relevant to your audience and purpose.
2. Customized Report Structures:
Structure your report logically:
- Start with an introduction that defines the report’s purpose and scope.
- Include a clear methodology section outlining data sources and analysis techniques.
- Present key findings through data visualizations with explanations.
- Conclude with a summary and potential recommendations based on the findings.
Tailor the report structure to the target audience: Technical audiences might appreciate a more in-depth analysis with detailed data tables. For a broader audience, focus on clear visualizations and concise explanations.
3. Visual Elements in Reports:
Data visualizations are crucial for simplifying complex data and highlighting trends. Utilize charts, graphs, and maps effectively.
Choose appropriate visualization types:
- Time series charts for tracking trends over time (e.g., daily energy consumption).
- Pie charts for illustrating the distribution of data points (e.g., charging locations).
- Heatmaps for visualizing spatial patterns (e.g., peak charging times across charging stations).
Ensure visual clarity: Use clear labels, consistent formatting, and appropriate color schemes. Avoid overloading visualizations with too much information.
4. Interactive Report Design:
Consider interactive elements for complex reports:
- Interactive charts allow users to explore data by filtering or hovering for details.
- Dashboards can provide a consolidated view of key metrics with drill-down options for deeper analysis.
Interactive features can enhance the user experience but should be implemented thoughtfully to avoid overwhelming the reader.
By effectively combining standard formats, customized structures, impactful visualizations, and well-considered interactive elements, you can create charging session reports that are both informative and engaging for your audience.
Charging Session Reports: Reporting Metrics
Selecting the right metrics is crucial for creating insightful charging session reports. Here’s a breakdown of key areas to consider:
1. Key Performance Indicators (KPIs) Tracking:
KPIs are quantifiable measures that track progress towards a specific goal. When it comes to charging session reports, relevant KPIs can vary depending on the stakeholder:
EV Owners:
- Average Charging Duration: Tracks efficiency and potential charging needs.
- Energy Consumption per Trip: Monitors charging habits and cost implications.
- Charging Cost per Session: Analyzes cost-effectiveness and potential for optimization.
Charging network providers:
- Station Utilization Rate: Measures efficiency and identifies under- and over-used stations.
- Average Charging Session Length: Helps optimize station pricing and service offerings.
- Revenue per Charging Session: Tracks financial performance and identifies profitable locations.
Utility Companies:
- Peak Charging Demand: Helps manage grid load and potential infrastructure upgrades.
- Average Energy Consumption per EV: Informs long-term energy planning strategies.
- Distribution of Charging Locations: Identifies areas requiring grid improvements for EV charging.
2. Metric Selection for Reporting:
Choose metrics aligned with the report’s purpose: For example, a report for EV owners might focus on individual charging efficiency, while a report for utilities might prioritize overall grid impact.
Consider the target audience: Select metrics that are relevant and understandable for the intended reader.
Data availability: Ensure you have access to the necessary data to calculate the chosen metrics.
3. Metric Interpretation and Analysis:
Analyze trends over time: Identify changes in charging habits, station usage, or energy consumption.
Compare metrics across different categories: For example, compare the average charging duration at home vs. public stations.
Benchmark against industry standards or best practices: See how your metrics stack up against the broader EV landscape.
4. Comparative Analysis of Different Metrics:
Comparative analysis can reveal valuable insights: For example, compare the station utilization rate with the average charging duration to understand if long charging times are impacting station availability.
Consider potential correlations between metrics: There might be a link between peak charging demand and energy consumption per EV.
Charging Session Reports: Charging Infrastructure Analysis
Charging session reports are a gold mine of data for analyzing and optimizing charging infrastructure. Here’s how to leverage them for this purpose:
1. Infrastructure Efficiency Evaluation:
Metrics like average charging duration and energy consumption per session can reveal charging station efficiency.
Identifying consistently long charging times might indicate a need for station maintenance or upgrades to higher charging rates (Level 2 or DC Fast Charging).
Analyze charging efficiency trends over time. Look for improvements due to infrastructure upgrades or changes in user behavior.
2. Charging Station Distribution Analysis:
Reports can reveal areas with high charging demand but limited station availability. This can inform the strategic placement of new stations.
Heatmaps can visually represent charging session locations, highlighting areas with high concentrations or gaps in coverage.
Analyze station utilization rates to identify underused stations that might be relocated to areas with higher demand.
3. Infrastructure Utilization Rates:
- Metrics like station utilization rate and average charging session length provide insight into infrastructure usage.
- Identify peak charging times to assess if existing infrastructure can handle the load.
- Plan for capacity upgrades at stations experiencing frequent congestion or long wait times.
4. Predictive Maintenance Based on Analysis:
Trends in charging session data can predict potential maintenance needs. For example, a rise in abnormally short charging sessions might indicate a malfunctioning charging port at a specific station.
Utilize data to schedule preventive maintenance and avoid disruptions for EV owners.
5. Additional Considerations:
- Combine charging session data with geographic information systems (GIS) for a spatial analysis. This can reveal correlations between station location, demographics, and charging patterns.
- Factor in external data sources like weather patterns that might affect charging efficiency.
- Incorporate user feedback: Surveys or app reviews can provide valuable insights into user experience and satisfaction with charging infrastructure.
Charging Session Reports: User Behavior Analysis
Charging session reports offer a window into how EV owners interact with charging infrastructure. By analyzing this data, we can gain valuable insights into user behavior and optimize the charging experience.
1. User Charging Patterns Identification:
Frequency of charging: Analyze how often users charge their EVs. This reveals reliance on home charging vs. dependence on public stations.
Charging duration: Identify typical charging times to understand user needs and potential range anxiety.
Time of day: Analyze the distribution of charging sessions throughout the day to understand peak charging times.
Location: Track where users charge most frequently (home, work, public stations) to understand charging habits and station usage patterns.
Energy consumption per session: This reveals typical trip distances or charging efficiency variations.
2. User Preferences Analysis:
Charging speed preferences: Analyze usage patterns of different charging levels (Level 1, Level 2, DC Fast Charging) to understand user preferences for speed vs. convenience.
Cost sensitivity: Track user behavior at pay-per-use stations to understand price sensitivity and potential demand for alternative pricing models.
Charging station amenities: Analyze usage patterns at stations with additional amenities (e.g., restaurants, retail stores) to understand user preferences for a more holistic charging experience.
3. User Satisfaction Metrics:
Direct user feedback: Surveys or app reviews can provide valuable insights into user satisfaction with charging infrastructure and the user interface of charging apps.
Indirect metrics: Analyze factors like session abandonment rates or repeat visits to specific stations to gauge user satisfaction.
4. User Behavior Impact on Charging Sessions:
Understanding user behavior can help optimize charging infrastructure:
- Placing stations in areas with a high frequency of short charging sessions (e.g., grocery stores).
- Offering a mix of charging speeds to cater to diverse user needs (quick top-ups vs. full charges).
- Implementing dynamic pricing models based on peak vs. off-peak charging times.
Charging Session Reports: Trend Analysis
Charging session reports hold immense value in uncovering long-term trends and predicting future developments in the EV charging landscape.
1. Long-Term Trend Identification:
Analyze historical data on charging frequency, duration, energy consumption, and location to identify trends over time.
Look for changes in user behavior: Increased reliance on public charging, adoption of faster charging options, or shifts in charging times due to battery advancements.
Track infrastructure development: Growth in charging station numbers, deployment of different charging levels (Level 2, DC Fast Charging), and geographic distribution of stations.
2. Trend Forecasting Techniques:
Statistical forecasting methods: Utilize time series analysis to project future charging behavior based on historical trends.
Scenario planning: Develop different scenarios considering factors like EV adoption rates, technological advancements, and policy changes.
Machine learning: Explore machine learning algorithms to identify complex patterns and predict future charging demand based on various data points.
3. Market Trend Impact on Charging Sessions:
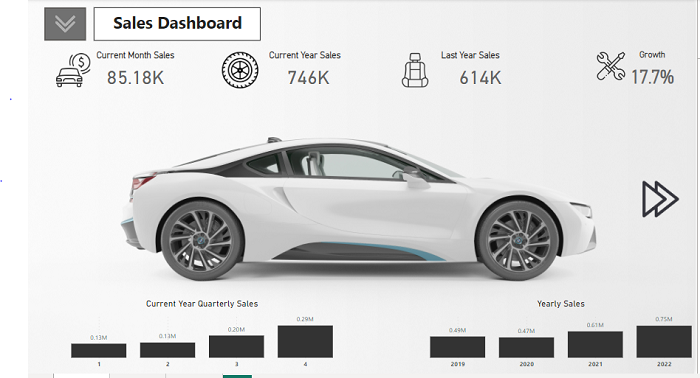
Monitor trends in EV sales: Rising EV adoption will likely lead to an increase in charging sessions.
Analyze battery technology advancements: Faster charging times and longer ranges might impact charging frequency and location preferences.
Track government policies: Incentives for EV ownership and charging infrastructure development can significantly influence charging session trends.
4. Competitive Trend Analysis in the Charging Industry:
Analyze the strategies for charging network providers: Expansion plans, pricing models, and partnerships with businesses or municipalities.
Track technology advancements from different companies: Developments in charging equipment, battery swapping technologies, or smart charging solutions.
Monitor user preferences: Identify emerging trends like demand for on-demand mobile charging services or integrated charging experiences within existing ecosystems.
By employing these trend analysis techniques with charging session reports, stakeholders can gain valuable insights to:
- Make informed investment decisions in charging infrastructure development or technology.
- Develop future-proof charging solutions that adapt to evolving user needs and market trends.
- Prepare for the growing demand for EV charging and ensure a robust and sustainable charging infrastructure for the future.
In conclusion, charging session reports are a vital tool for both individual EV owners and the broader EV ecosystem. They provide valuable insights into charging habits, optimize charging infrastructure, and contribute to a more sustainable future. As the EV market continues to grow, the importance of these reports will only increase, playing a key role in shaping the future of electric mobility.

Henry Michael is a leading expert in EV charging station research, specializing in innovative solutions for electric vehicle infrastructure. With a passion for sustainability and technological advancement, he is dedicated to advancing the accessibility and efficiency of EV charging worldwide.